
Updated on Aug 30, 2024
PageSpeedPlus allows you to Monitor Lighthouse Scores for any website. Setup involves a few clicks and afterwards, your website URLs will be scanned on a schedule to keep track of scores over time. The data is then presented in our dashboard for analysis.
Lighthouse is the official tool that Google provides to measure website speed and quality. It is shipped as an inbuilt part of Chrome so achieving good scores will have a big influence on the website search rankings.
PageSpeedPlus was designed to solve this specific problem so get started with a trial today by clicking the button below or read on to find out more.
 Steps to Monitor Lighthouse Scores
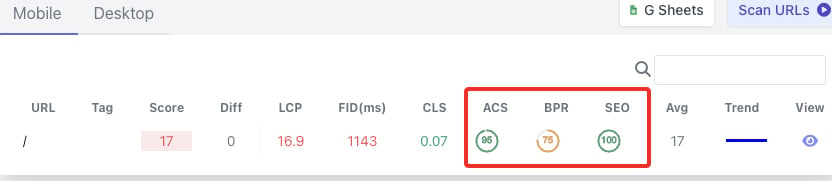
The homepage will now be scanned. When finished, click into the website record and you will see Lighthouse scores for the URL alongside the Web Vitals metrics.
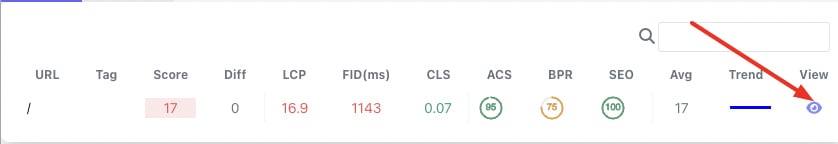
To go deeper, click the view link to see detailed URL level analytics.
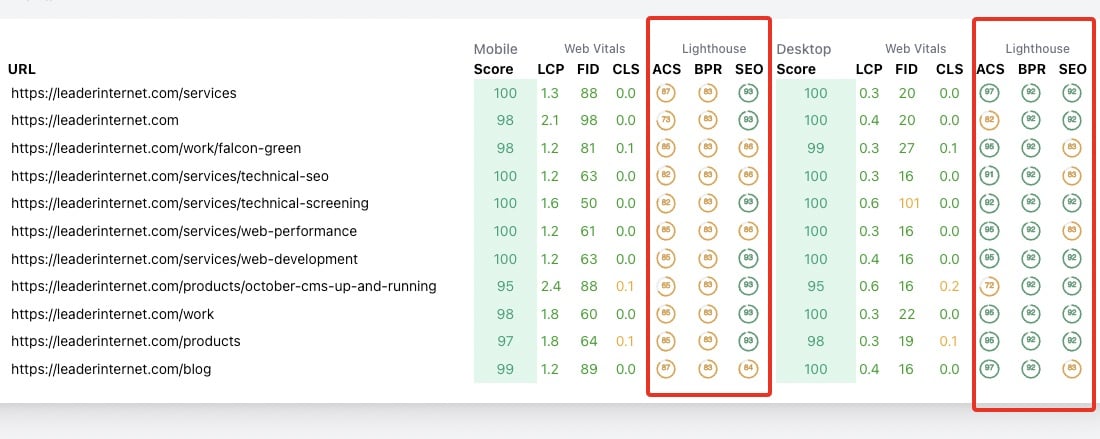
Here you will see Lighthouse scores over time along with historical performance, Web Vitals, CRuX and Global Loading Times data providing a rich source of information that can be used for debugging and analysis of multiple problems. The charts have colored backgrounds to not only show the score but also whether it's bad, average or good.
Add more URLs
Simply enter more URLs to start monitoring their Lighthouse Scores.
If you want to measure Lighthouse scores for your entire site, go to the Full Site Scan section and paste the sitemap.xml path to get a scan started.
Quick Tip
The trend charts will look empty until a few scans have completed so remember to check back in a few days.
Lighthouse has four key metrics (It used to be five but PWA is no longer included by Google).
All of these are tracked by PageSpeedPlus so you can get a full overview of Lighthouse scores in one place without having to manually run scans.
In addition, we also track PageSpeed Insights history and Monitor Web Vitals, CRuX and Global Loading Times so every metric that matters in performance and user experience is available in our tool for tracking and analytics.
When a URL is scanned, we pass it through the PageSpeed Insights API multiple times until we get three successful responses on mobile and three successful responses times on desktop. Multiple runs allow us to get an average score which is more representative of real world grades from cold and warm cache hits.
Yes. PageSpeedPlus offers two types of scans - Monitored URLs and Full Site Scans.
Monitored URLs scans can run hourly and scan each page multiple times and measure more things such as global loading times, which is a feature that tests website speed from multiple locations.
Full Site Scans run weekly and scan each page only once, capturing a smaller set of information.
Getting the data in is only half of the task. We know our users need to be able to get it out as well for reporting and presentations. Most of the time, simply viewing it in our dashboard will be sufficient but for those occasions when you need to export the Lighthouse data, the options are:
Google Sheets
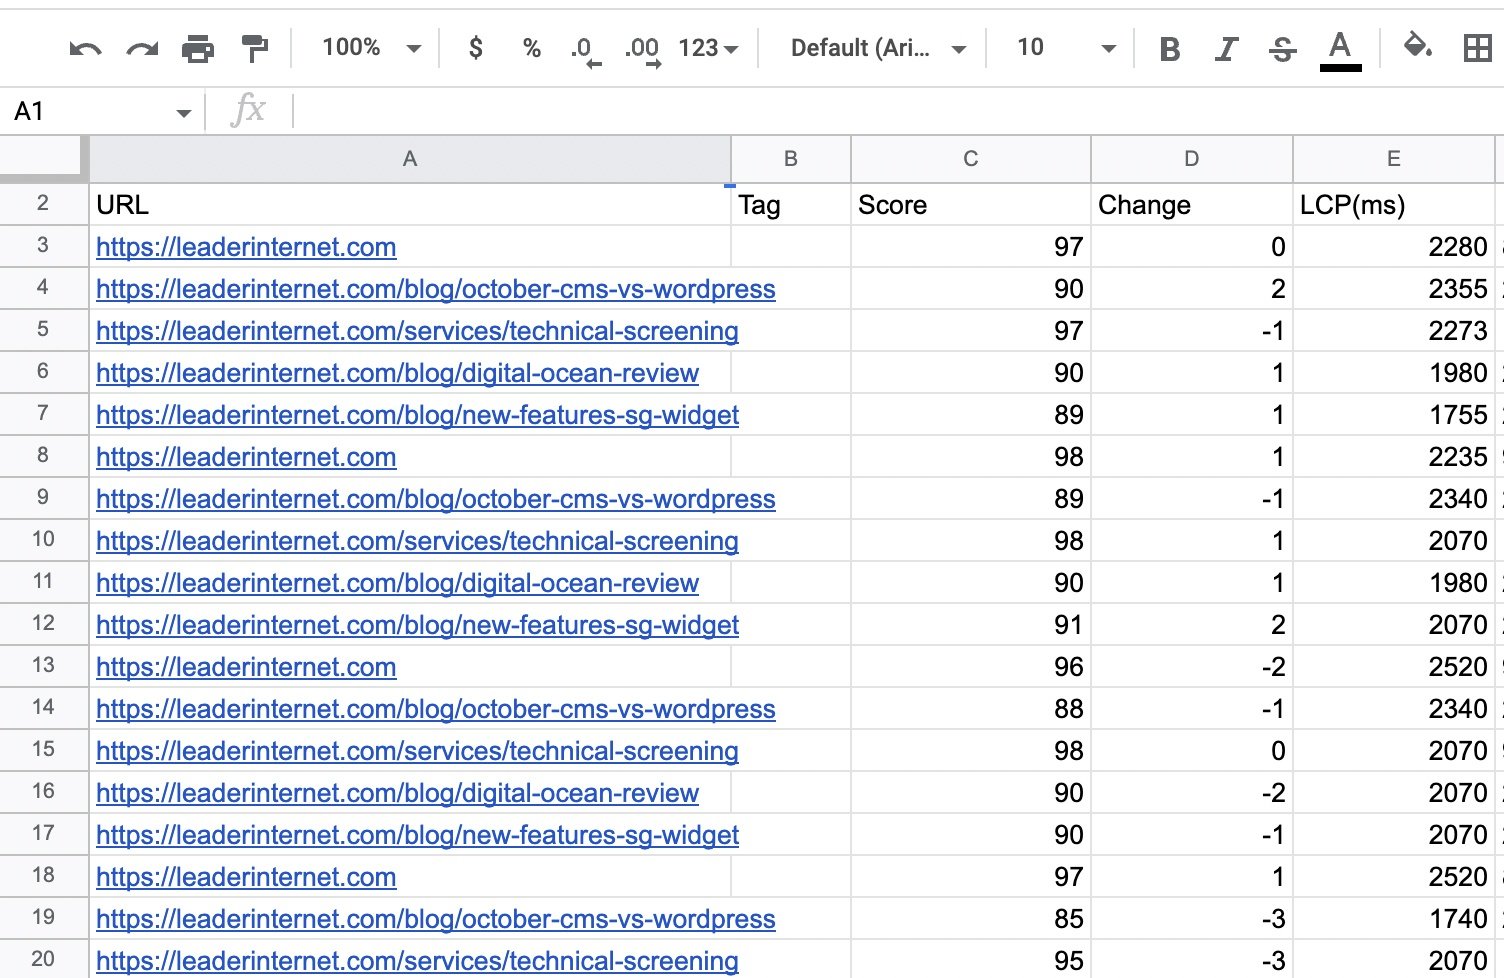
All Monitored URL scans are automatically exported to a google sheet for your site. Each scan of a URL adds one record to the google sheet. From there it can be ingested into any tool of your choosing.
PageSpeedPlus API
All scans are available through our API. Check our API docs for more information on how to create a token and make a request
Export from the dashboard
If you just need the most recent scores, those can be exported by clicking any of the buttons in the Monitored URLs section of the dashboard.
Export a Full Site Scan
Lighthouse data is available in full site scans and the data can be downloaded in excel, CSV or PDF format.
The internet has always had guidelines on the experience websites should provide to users.
However, until Lighthouse came along, it was difficult to get a quantifiable metric for actually measuring this experience outside of performance. This meant that developers often overlooked some aspects or over-focussed on one such as loading speed at the expense of others like accessibility.
Lighthouse brings balance to how website quality is measured and gives a holistic view of all the things that are important for website users.
When good scores have been achieved, it doesn’t mean they will stay like that. All websites experience changes from a variety of sources. Developer releases, new content, data ingested from APIs, marketing tags updating, servers slowing down, etc mean that two loads of the same page are never the same. All of these factors have an impact on how the page renders and can cause lighthouse scores to go up or down.
To ensure visibility on score shifts, automated monitoring needs to be in place to get alerts when the score changes and secondly, to assist with retrospective analysis when debugging past performance issues.
PageSpeedPlus was designed specifically to monitor Lighthouse scores, PageSpeed Insights and Web Vitals so the features are very specific to these challenges and positions us better than tools which bolt on a lighthouse feature.
Some of the benefits this gives PageSpeedPlus are:
 Scale - scanning lots of URLs every hour is complex and resource intensive. PageSpeedPlus use elastic infrastructure and intelligent queuing to achieve this efficiently.
Accuracy - each URL is scanned multiple times so we can get an average, which is better than a single scan that can be impacted by cold caches
Monitored URL and Full Site Scans - important URLs can be tracked hourly. We can also scan the entire site once a week
Usability - Presenting so much data is a challenge. Our UI and API is optimised for this instead of squeezing it in between other data.
Data Exporting- Lighthouse scores are automatically exported to Google sheets and available in our API
Monitoring Lighthouse Scores is made possible by PageSpeedPlus. It’s easy to setup and doesn’t require any code to be written or scripts to be managed. Not only do Lighthouse scores need to be good, they also need to stay good which requires tracking.
Activate Lighthouse Monitoring for your website by clicking the button below or if you have any questions just get in touch and we’ll respond as soon as the message is seen.