Updated on Dec 11, 2021
We’ve added plenty of new features recently to ensure PageSpeedPlus continues to evolve with the ever-changing Pagespeed landscape. Many of these are in response to user feedback and requests so here are some of the highlights to show how we are catering for the needs of our audience.
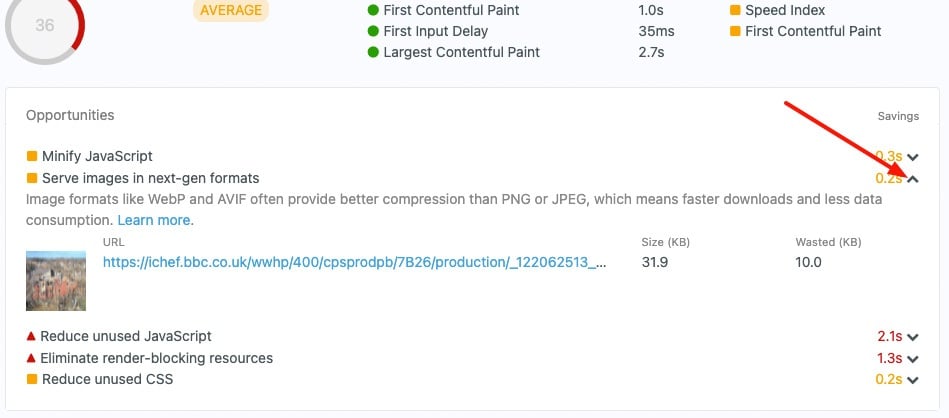
A highly requested feature was the ability to view Opportunities data in the dashboard. Our platform has a great UI for presenting charts and trend data over time to show where scores are low. Of course, when grades are poor, people want to improve them, which is especially true for performance conscious users of our tool. The details page of every URL now contains opportunities information to show areas a specific page can be improved.
How to access
Going hand in hand with Opportunities data is Diagnostics. This shows exactly what needs to be fixed in technical terms along with links to guides that explain the problem in more detail.
How to access
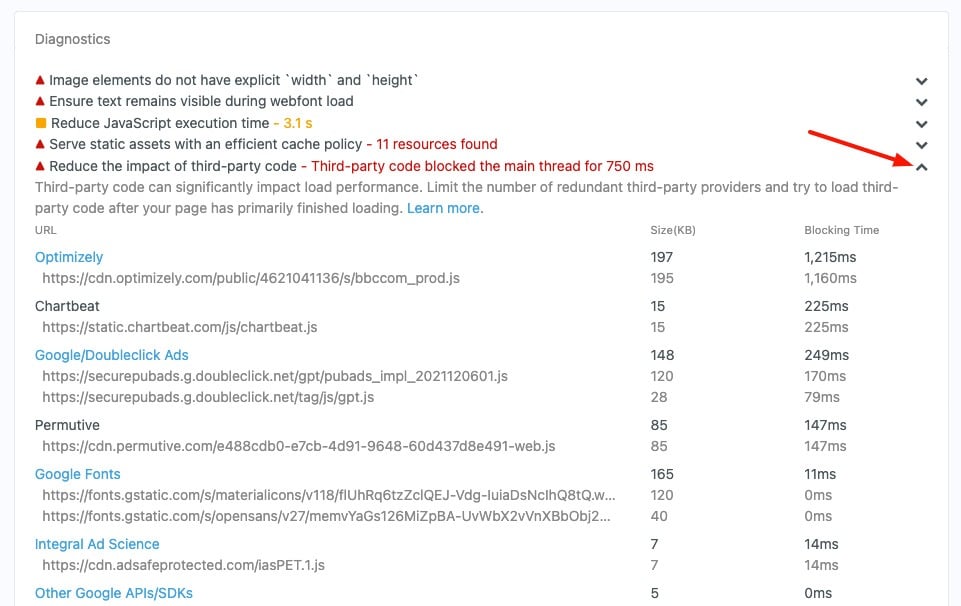
When PageSpeed Plus sends an alert that your scores are low, you can now see exactly why with Opportunities and details on how to fix it with Diagnostics information.
The Opportunities and Diagnostics information presented by default is for the most recent scan. With the date selector on the URL details page, you can view any previous scan.
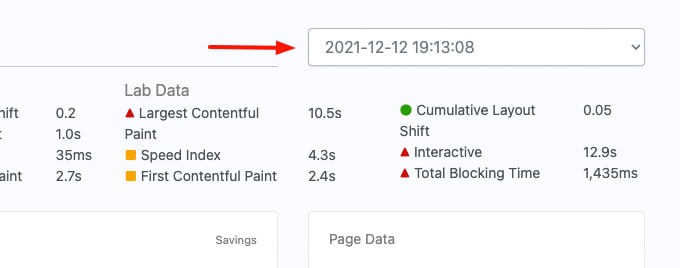
This allows you to look at any point in time in the past and see exactly what the state and analysis of your page was with data, screenshots and times. Insight like this is immensely useful when retrospectively tracing the root cause of pagespeed changes and makes the debugging process easier, which developers will be glad to hear.
Regular users will have noticed a Google Sheets button appearing a few months ago.
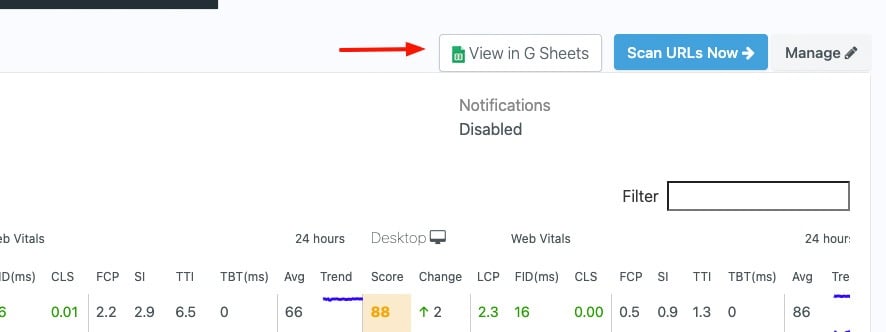
This is in response to users telling us they wish to export data so Google Sheets can be analysed in other tools, which is common for Technical SEOs. While this could take users away from our platform, we believe the quality of the data will ensure that we remain the number one source of PageSpeed Insights information for a website.
Our initial Google Sheets implementation was basic to and thanks to the positive feedback from early access users, we’ve now added Field Data. In your Google sheet, you will see a column for the overall scores and then columns for FID, FCP, LCP and CLS for desktop and mobile.
Every data point you need is now automatically pushed to your websites Google sheet so you can export it as a CSV or Excel and analyse it in whatever tool you need. To get there, just click the Google Sheet button in your site and enter the email address you wish to access it with.
When Web Vitals were launched only a subset was available from Google, which was FID and FCP and we made these available in PageSpeed Plus.
Google recently made more data points available and we’ve since added these to our reporting suite. This means all Web Vitals data can be monitored in PageSpeed Plus for mobile and desktop.
As we add more data, presenting it all on one screen becomes difficult due to the sheer volume. User experience is as important as the data itself so as we enhance our platform, we continue to tweak the UI to suit.
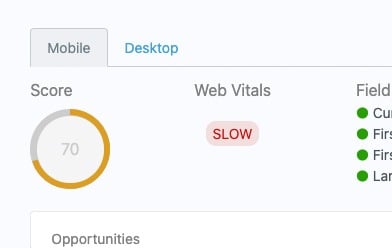
One of the major changes is the addition of tabs on the URL details page. It’s now broken into mobile and desktop views so you can analyse each platform separately in an easy to view manner.
All the features discussed here are live and available to use in PageSpeed Plus today. We’re not stopping there and have a deep roadmap lined up for 2022. To give you a sneak peak, some of the highlights are:
Our roadmap is constantly evolving in reaction to user feedback so if you have a suggestion for PageSpeedPlus or see something that could be improved, just get in touch with us.
These are just some of the recent features added. Users will notice many more large and subtle differences in the platform. If you aren’t yet a customer, start a trial today and see for yourself.