We’ve been quiet on the blogging front recently because we’ve been busy planning, developing and iterating on new features to improve the best PageSpeed Insights monitoring tool on the market.
Here is an overview of the main updates.
In May, Google announced Web Vitals, which is an initiative to provides a consistent set of metrics for measuring website performance across all of their tools. Web Vitals became available in version 6 of the PageSpeed Insights API and we immediately integrated the data into our service.
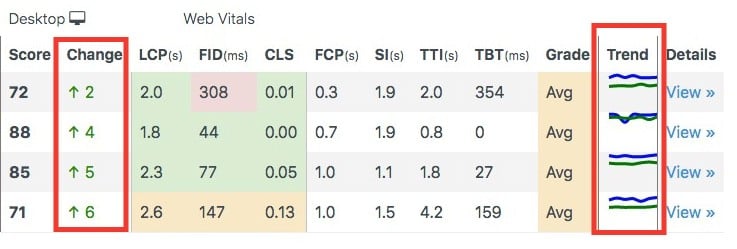
Monitored URLs now have three additional columns specifically for Web Vitals: Largest Contentful Paint (LCP), First Input Delay (FID) and Cumulative Layout Shift (CLS). You can see these in the monitored URLs table within a site. To help you get a quick overview of the status, the scores are colour coded - red for poor, amber for average and green for good.

It’s still early days but it’s clear that Google will place a lot of emphasis on Web Vitals scores in the future. If you want Google to view your site as fast then you need to keep track of your scores to make sure they are good. PageSpeed Plus has you covered.
More information about Web Vitals is available on the web.dev blog
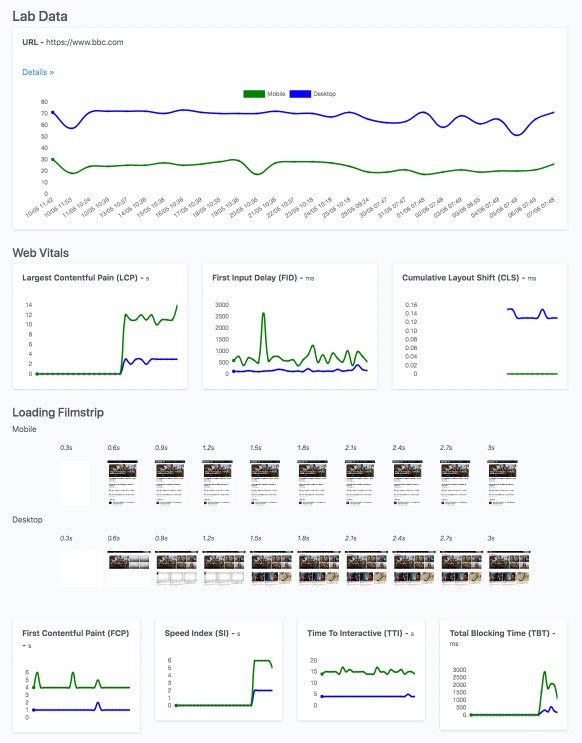
Users told us it would help if they could see more information about each URL so they can get a full picture of how pages are performing. Therefore we have added the following lab data points:

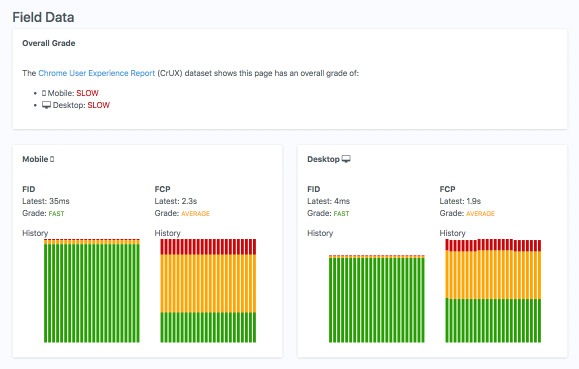
In addition to lab data, we’ve also added field data from the Chrome User Experience Report (CrUX) dataset. This provides user experience metrics for how real-world Chrome users experience popular destinations on the web rather than synthetic lab testing in perfect conditions.

Not every website has data available in the Chrome User Experience Report as sites have to reach a certain level of traffic before they are included but if your site is there, then we display the information.
All of these metrics can be viewed on any URL details page and help to give a more rounded view of page performance and which metrics can be improved.
Viewing the recent score for a page is fine but more context is gained if you can also see some of the previous scores to assess whether things have improved or gotten worse. Previously, this would have meant clicking into every URL details page to see the history. To streamline this process, a Change column and Trend chart now exist on the Monitored URLs table so you can see at a glance if URLs are up or down in recent scans.

PageSpeed matters for SEO so High grades are important but you don’t always need to score 90+ to see benefits.
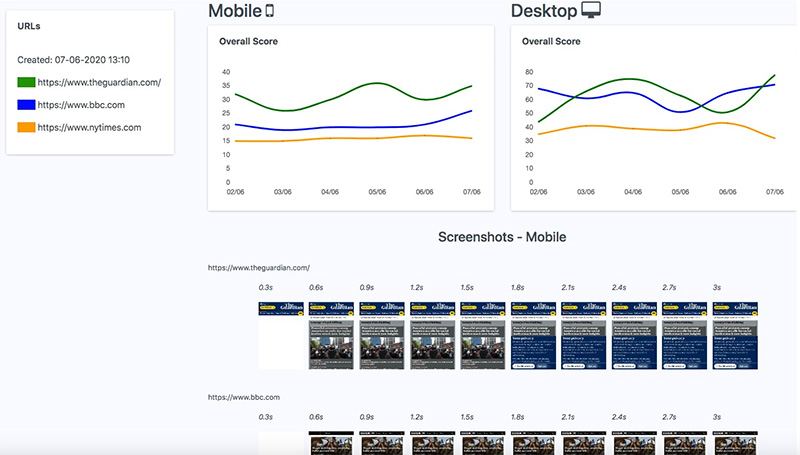
If you are scoring better than your nearest competitors then it’s likely Google will look upon your site more favourably. We’ve made this very easy to measure by adding a Comparison feature where you can select a collection of URLs and generate a report that compares them side by side. Each report will compare all of the metrics that we track on both mobile and desktop along with a filmstrip containing screenshots of the loading experience. Everything is presented side by side in elegant charts for easy comparison.

To compare URLs, they have to be monitored in your account first. After that, click the compare tab and select the URLs you want to compare. You can choose up to 10.
We’re already received a lot of positive feedback on this feature from customers who use it to compare their clients' sites against others. It helps to convey the point when explaining the importance of PageSpeed to non-technical users in presentations and internal reports.
Our dashboard has received a fresh lick of paint and new UI features. The popular site homepage has returned which lists your sites and an overview of the monitored URL scores along with the time of the latest scan. Click into each site and you will find an enhanced URLs section that gives a concise overview of your scores for the monitored pages on that site.
That’s all for now. If you have any features or improvements you’d like to see, just let us know.